
Petroleum in Pakistan: Products, Supply and Prices
Understand petroleum in Pakistan, from crude oil and refining to petrol, diesel and official price notices, with a simple household cost example.

Petroleum in Pakistan is a chain of different products, organisations and prices, not one interchangeable commodity. Crude oil is processed into usable fuels, while finished products can also be imported. Understanding those distinctions helps explain why a global oil headline, a refinery announcement and a retail pump price can tell different stories.
For households, the practical questions are which fuel is being discussed, when an official price takes effect and how a change alters spending. For students, the wider lesson is to separate physical supply from pricing and economic impact. This guide explains that structure without quoting an unverified current rate or assuming a nationwide shortage from a local queue.
How are crude oil, petrol and diesel different?
Crude oil is a raw mixture processed by a refinery, while petrol and diesel are finished fuels with different characteristics and uses. They are not alternative names for the same substance. A price or supply statement must identify the exact product before it can be interpreted reliably.
Refining separates and processes crude into product streams, with further treatment and blending used to meet specifications. The output depends on the crude feed and refinery configuration. A barrel of crude does not become only petrol, nor can every refinery produce any desired product mix instantly.
Petrol may appear in documents as motor gasoline or MS. High-speed diesel is often abbreviated HSD. Kerosene, jet fuel and furnace oil are other distinct products. LPG belongs in a separate product discussion even though it can appear beside liquid fuels in broad energy coverage.
Do not assume that one product's price adjustment applies to all the others. A headline may mention petrol while the underlying notice contains separate rows. Read those rows before calculating transport or household effects.
The product distinction also matters for equipment. A fuel suitable for one engine is not automatically suitable for another. Follow the manufacturer's specification rather than choosing solely by a price comparison or a general claim about fuel strength.
How does fuel reach a retail pump in Pakistan?
Fuel reaches customers through sourcing, processing or import, storage, transport and distribution. Domestic production, imported crude and imported finished products can all enter the broader supply chain. Each stage has its own capacity and timing, so an issue at one location does not automatically describe national availability.
A refinery turns feedstock into products, while an oil marketing company arranges supply and distribution within its business. A terminal stores and handles product before onward movement. A retail outlet supplies the customer. These roles can be connected commercially without becoming the same operational activity.
Transport may involve a pipeline, road tank lorry or other arrangements appropriate to the route. The presence of fuel at a port or refinery does not mean every station can receive it immediately. Loading, transport availability and storage space can all affect delivery timing.
Inventory is a stock available at a point in time. Demand is the rate at which customers require product. Comparing them requires matching units and periods: tonnes in storage cannot be compared directly with litres per day without conversion and a clear product basis.
A useful supply-chain diagram begins with the product and follows the physical route. Add commercial ownership separately. This prevents an announcement about a purchase contract from being mistaken for confirmation that every litre has already reached retail outlets.
Watch the location in a shortage claim
A delivery delay at one station, a regional transport interruption and a national supply shortage are different claims. Each needs evidence at the appropriate scale. Photos of a queue can establish a queue, but not the total stock available across the country.
Why does a fall in crude oil not guarantee an equal pump-price cut?
A crude benchmark is one input to the broader cost chain, while a local product price can also reflect refined-product costs, currency conversion, freight and policy components. The timing and calculation method matter. A percentage move in an international headline therefore cannot be copied directly onto a rupee price.
A benchmark quoted in dollars per barrel differs from a retail amount expressed per litre. The units, currency and product must be aligned before comparison. Even after conversion, the result is not automatically the notified sale price because other components may apply.
Exchange rate changes can offset part of a dollar-price movement. In a hypothetical example, a product cost of 100 dollars converted at 280 rupees equals 28,000 rupees. A fall to 95 dollars converted at 300 equals 28,500 rupees. The dollar cost fell while the converted amount rose.
This example explains arithmetic, not a current import bill. It illustrates why claims about the rupee, crude and local fuel need a shared time period. Comparing today's exchange quote with a product purchased under an earlier pricing window can mislead.
Import parity and ex-refinery terminology refer to specific pricing concepts. Use the definitions in the relevant policy or calculation sheet, rather than assuming either label means the consumer's final bill. A chain of related prices is still a chain of distinct measurements.
What components should you look for in a fuel-price document?
Look for the product, units, effective date and stated price components before reading the final total. Historical official buildup tables show categories such as petroleum levy, freight and dealer margin. Their presence illustrates the structure, but the applicable rates and treatment must come from the relevant current document.
A tax, levy and commercial margin are not the same accounting category. Do not combine them under one label merely to simplify a headline. Similarly, a blank or zero cell applies to the product and period shown; it should not be treated as a permanent rule.
The effective date is the date the notice says the change applies. It can differ from publication time or the day a market moves. A forecast, recommendation and implemented price notification are different stages, so use wording that matches the document.
For a comparison, keep the old and new prices from the same product category and unit. Then calculate the rupee difference and percentage change separately. The latter is the difference divided by the old price, multiplied by 100.
| Item | What it describes | Common mistake |
|---|---|---|
| Crude benchmark | A referenced raw-oil price | Treating it as petrol per litre |
| Exchange rate | Currency conversion | Mixing dates or quote directions |
| Levy or tax | A policy component | Assuming the old rate is permanent |
| Commercial margin | A specified distribution component | Calling it the full company profit |
| Effective retail figure | The relevant customer-facing amount | Using a forecast as an implemented price |
How do you calculate the effect on a household budget?
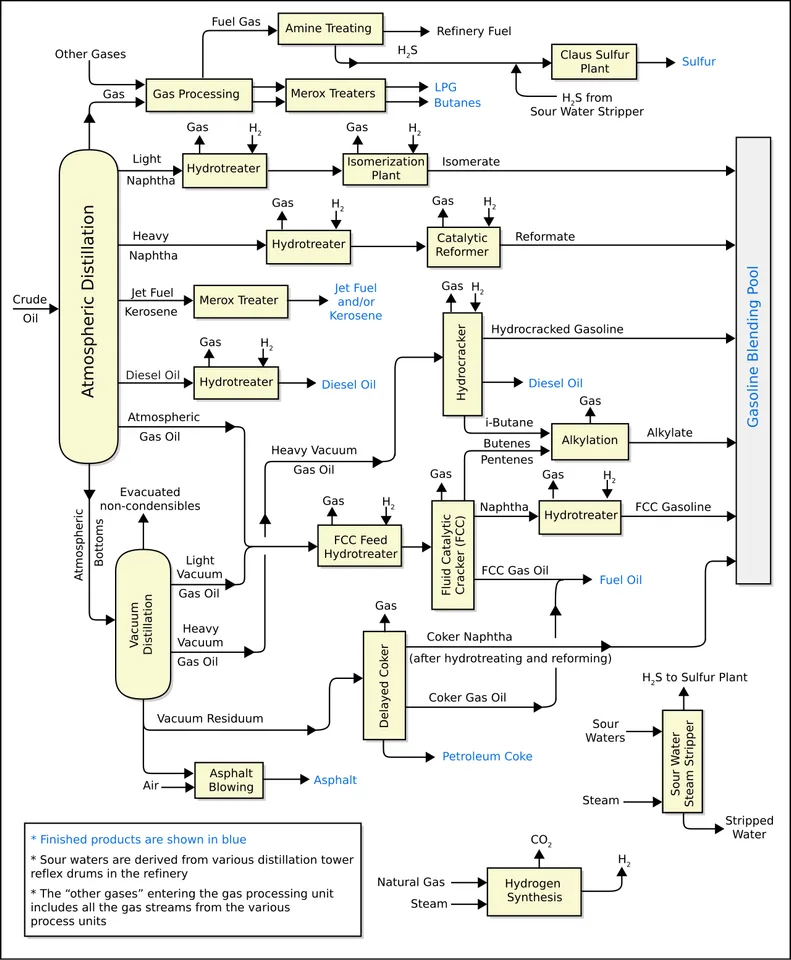
A generic refinery flow diagram helps trace processing from feedstock to products; it does not describe a particular Pakistani plant.
Multiply the price change per litre by the number of litres you expect to buy, then separate price effects from changes in fuel use. This gives a clearer household budget estimate than applying the headline percentage to every transport expense. The method works with a verified price or a clearly labelled hypothetical scenario.
If a hypothetical increase is five rupees per litre and monthly use is forty litres, the extra fuel cost is 200 rupees. If use rises to fifty litres at the same time, that additional consumption creates a separate cost. Keep the two effects visible.
Fuel economy adds another useful measure. If a vehicle travels 400 kilometres on twenty litres, the observed average is twenty kilometres per litre. At an illustrative price of 250 rupees per litre, the fuel cost is 12.5 rupees per kilometre. These are teaching values, not current quotations.
Use several comparable refills before treating one observation as a lasting change. Traffic, route, loading and driving conditions can alter consumption. A single difficult journey does not prove a permanent mechanical problem or a change in fuel quality.
For a family decision, compare total trip requirements rather than only pump prices. A shorter route with severe congestion may not use less fuel. Public transport or shared travel also involves schedule, accessibility and time, which belong in the practical comparison.
Why can supply and price move differently?
Supply describes availability and movement of product, while price reflects a different set of commercial and policy processes. The two interact, but a price notice does not prove that delivery conditions are identical everywhere. Likewise, a local delivery problem does not establish the next official price adjustment.
An inventory buffer can reduce the immediate effect of a delayed shipment, while storage or transport constraints can prevent stock from moving smoothly. The relevant question is where the constraint lies and how long it affects usable supply.
Working capital can matter to businesses arranging purchases and holding inventory. That financial requirement is distinct from physical refinery capacity. A company can face a cash constraint even when the equipment exists, and available cash does not create instant transport capacity.
Avoid predicting shortages from one indicator. A credible assessment would combine stock data, demand, delivery schedules and operational information, with dates. Without that evidence, describe the specific interruption reported rather than a national conclusion.
The same care applies to a supply agreement. It may support procurement planning, but its existence does not guarantee every future delivery or a lower consumer price. Contract terms, execution and the wider policy framework remain relevant.
A useful student investigation
Choose a hypothetical delay at a terminal and trace possible consequences. Identify which customer areas depend on that route, what alternate supply might exist and which facts would be needed to estimate duration. This exercise teaches causal reasoning without inventing a real disruption.
How does petroleum relate to inflation and transport costs?
Petroleum can influence direct household spending and the cost of moving goods, but its effect on wider inflation is not identical or immediate for every item. The size and timing depend on fuel use, business arrangements, other costs and the statistical measure being examined.
A transport operator may face fuel, wages, maintenance and financing expenses. If fuel is only one part of the total, a given fuel-price percentage change does not mathematically imply the same percentage change in the full fare. The actual response also depends on rules, contracts and business decisions.
For a hypothetical cost basket of 100 units with fuel contributing 30, a ten percent increase in the fuel component adds three units before other changes. This is an accounting illustration, not a forecast of any Pakistani fare or national inflation outcome.
CPI measures price movement across a defined consumer basket, while SPI tracks a selected set under its published methodology. A single pump price is an item price, not the inflation rate itself. Compare the relevant periods and definitions before saying that an indicator confirms a fuel headline.
Separate slower inflation from falling prices. If prices are rising more slowly, the level can still be higher than before. A household may therefore feel continued pressure even when the rate of increase declines.
How can readers assess a petroleum headline responsibly?
Identify the product, location, period and claim type before deciding what the headline means. Then check whether the evidence concerns a price, a physical shipment, a policy decision or a company agreement. These categories can be connected, but none should silently stand in for the others.
For a price story, find the effective notice and exact product row. For a supply story, seek dated operational evidence at the claimed geographical scale. For a company story, identify the legal entities and document type. A board approval and a completed delivery establish different facts.
Check units before calculating. Tonnes, barrels, litres and percentages require clear definitions and conversions. Avoid using a crude conversion factor as though it applied identically to every finished product, because density and product characteristics can differ.
When a claim includes fuel quality, ask which specification and test supports it. Octane describes an aspect of petrol's resistance to engine knock; sulfur content concerns a different property. A higher number on one measure does not establish every desirable characteristic of a fuel.
A useful final note contains three sentences: what is verified, why it matters and what additional evidence would be needed for a larger conclusion. For example, a dated price change can support a household calculation, but not a claim that every food item must rise by the same percentage.
For classroom work, build a two-column glossary of physical and financial terms. Put refinery, storage and distribution on one side, then exchange rate, levy and margin on the other. Draw connections only where you can explain the mechanism. The result makes petroleum coverage easier to read because it exposes where a story jumps from one part of the chain to another.
Keep the final interpretation proportional to the evidence. A sound explanation can be useful without publishing a live price or predicting the next adjustment. Its value is helping readers distinguish products, understand calculations and recognise which document answers the question they actually have.
To compare transport costs over time, keep a small record of distance, litres, paid amount and journey type. Calculate the fuel component separately from parking, fares or maintenance. This makes the comparison more transparent and helps distinguish a higher price from more travel. For a business example, use the same route and load before discussing efficiency. A tidy calculation with mismatched journeys can still produce a misleading conclusion, so comparable inputs matter as much as correct multiplication.
For a product-specific document exercise, use the Pakistan petrol-price notification guide. The economy-indicators explainer places item prices within wider measurements, while the PSO–Attock agreement guide shows how procurement news differs from a retail-price decision. Choose the companion explanation that matches the claim you are investigating, rather than treating all petroleum headlines as one question.
Sources
Source 1, Source 2, Source 3, Source 4, Source 5
Image credits: Cover: Nefronus, source, CC0. Resized and converted to WebP. Article image: File:RefineryFlow.png : Mbeychok derivative work: Begoon, source, CC BY-SA 3.0. Resized and converted to WebP.
Found an error or an outdated detail? Report a correction with the article URL and original source.