
India: A Geography and Source-Reading Study Guide
Build a clear India country profile using geography, languages and dated official statistics, while separating a country from its cricket team.
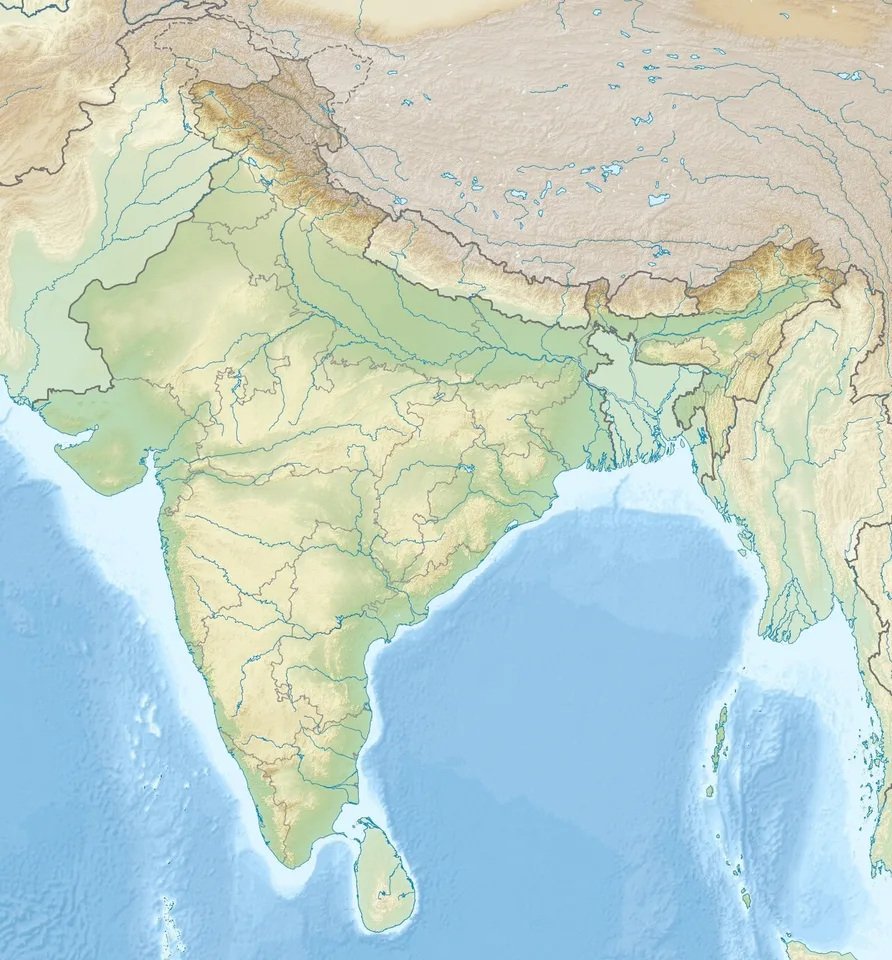
India is a South Asian country whose geography is best understood through relationships: mountains and river plains, rainfall and farming, cities and transport, languages and regional history. A useful India country profile explains these connections with a map and dated evidence. It should help a reader understand places rather than memorise an unsupported list of national rankings.
For students in Pakistan, studying a neighbouring country also offers practice in careful comparison. Shared regional environments do not make societies identical, and national boundaries do not explain every cultural or economic pattern. This guide focuses on physical geography, population concepts and source reading. Its practical outcome is a defensible school assignment with clearly defined facts, meaningful examples and room for uncertainty.
Where is India, and how should you read its map?
Locate India within South Asia, with the Arabian Sea to the west, the Bay of Bengal to the east and the Indian Ocean to the south. Then inspect the map's scale, legend and publication date. A political map shows jurisdictions, while a physical map emphasises elevation, landforms and water systems.
Use the north arrow and latitude lines before identifying individual cities. Relative position is often more useful than a long coordinate list: a coastal city faces different transport and weather conditions from an inland mountain settlement. A map scale helps distinguish a short-looking line on a continental map from an actual journey involving substantial distance.
Treat international boundaries and internal administrative boundaries as different features. Some borders are disputed, and publishers can represent them differently. In an academic assignment, identify the map publisher and follow the boundary conventions required by the course. Do not quietly modify an atlas image or present a simplified classroom outline as a complete statement of every territorial issue.
New Delhi is the national capital, but capital city, largest city and metropolitan area are separate concepts. Before comparing city populations, establish whether the source counts municipal limits, an urban agglomeration or a wider metropolitan region. An attractive city-ranking graphic can become misleading when it compares different geographical units under a single label.
How do mountains, plains and plateaus shape the country?
India's major physical regions include the Himalayan mountain zone, extensive northern river plains, desert landscapes and the southern peninsula. These broad divisions are a starting framework rather than a complete inventory. Relief affects transport routes, settlement opportunities and water movement, but it does not determine every economic or cultural outcome.
On a blank map, mark the Himalayas, the northern plains, the Thar Desert and the Peninsular Plateau. Add the Western Ghats and Eastern Ghats along the peninsula. Then choose one question for each feature: where can roads cross, where can rivers deposit sediment, or how might steep slopes change the costs of construction?
The Ganga, Brahmaputra and Indus systems are important to regional physical geography, but a river basin and a country are not the same unit. Rivers and their tributaries can cross national borders. When discussing a basin, show upstream and downstream relationships instead of assuming the water system begins and ends at the political boundary.
For an explanatory paragraph, compare a hypothetical settlement on a flat floodplain with one on a steep hillside. The first may have easier road construction but exposure to flooding; the second may have limited flat land and different access constraints. These are analytical possibilities to investigate, not claims that every plains town or mountain community faces identical conditions.
Why does the monsoon matter beyond a weather forecast?
The monsoon describes a seasonal circulation pattern associated with changes in winds and rainfall. Its geographical significance lies in the timing and distribution of water, not simply the idea of a rainy season. For a country study, distinguish weather on one day from climate patterns observed over longer periods.
A rainfall map can reveal differences hidden by a national average. Ask whether the figures represent a particular month, an annual total or a long-term average. Compare the same period across locations. A city experiencing a wet week does not establish that the entire country has unusually high annual rainfall or that a seasonal pattern has permanently changed.
Use an illustrative farming calendar to show why timing matters. A crop planned around expected rains can face a different problem when rain arrives late than when the annual total is adequate but concentrated into fewer days. The classroom lesson is to examine distribution and timing together, rather than reducing agricultural conditions to one annual number.
Climate connections should also include cities. Heavy rainfall can affect drainage, transport and school access, while a prolonged dry spell can place different demands on water storage. To make a concrete assignment, select one city and compare its physical setting with its rainfall graph. Explain a plausible connection, then identify what additional local evidence would be needed to confirm it.
How can you describe India's languages and culture accurately?
Describe linguistic and cultural diversity by naming the relevant region, community and source. Avoid presenting one language, festival, food or film tradition as universal. Official language status, a person's mother tongue and the language used at school can be different categories, so a careful profile explains which category it means.
For legal terminology, the Constitution and official language legislation provide the appropriate starting point. Hindi in Devanagari has a specified role for Union official purposes, while English continues to be used under the applicable law. That institutional arrangement should not be simplified into a claim that every resident speaks the same language or shares one linguistic identity.
A better school project compares two local examples. Students might investigate how language appears on a railway sign, in a textbook or in a municipal notice, recording the place and the document date. Such an exercise teaches observation without assuming that one sample represents every state, district or household in the country.
Separate culture from stereotype by asking who is included in an example. If describing a regional dish, identify the region and avoid treating it as the daily meal of every person. If studying a festival, distinguish participation from national population statistics. A precise, limited example usually teaches more than a sweeping sentence about what all people supposedly believe or enjoy.
What do population statistics actually tell students?
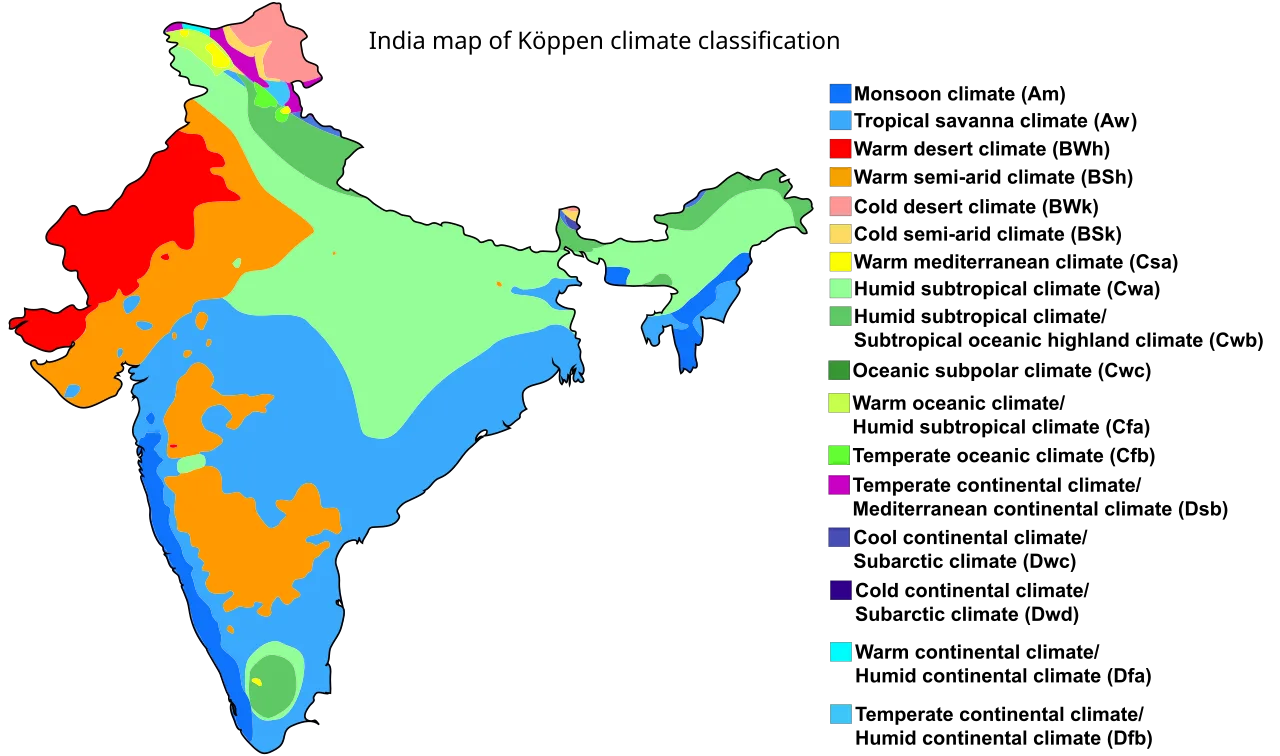
Climate-classification map published in 2016, useful for comparing regional patterns rather than daily weather.
Population statistics describe a defined group at a defined time using a particular collection or estimation method. A census count, a projection and a survey estimate serve different purposes. Before repeating a number, record the reference year, geographical coverage and definition. The publication date may differ from the period measured.
Population density means people relative to area, but an average can conceal uneven settlement. A large region containing both sparsely occupied terrain and crowded cities may have a moderate overall density. Use a district map or settlement map to investigate that pattern before concluding that residents are distributed uniformly across the region.
Urbanisation also requires a definition. An urban population share depends on how settlements are classified, and classifications may change between statistical releases. Compare like with like when discussing trends. A change in administrative boundaries can alter a city's counted population even if it does not represent an equivalent movement of people during that period.
Try a simple hypothetical comparison: Region A has twice the population of Region B and four times the land area. Region A is more populous but has half the density. This exercise exposes the difference between population size and population concentration. Ask students to write both conclusions in words before using any ranking or chart.
How should economic information appear in a country profile?
Economic information becomes meaningful when the measure, units and period are explicit. Gross domestic product describes production, GDP growth describes change and GDP per capita divides output by population. These measures cannot substitute for household income, income distribution or the experience of every worker. Use them as distinct pieces of evidence.
A nominal GDP comparison uses current prices and can be affected by exchange rates when converted into a common currency. A purchasing power parity comparison addresses a different question about price levels and purchasing capacity. A profile should name the method rather than claiming a country has one permanent, context-free position in the world economy.
National accounts describe the economy systematically, while sector descriptions need equal care. Agriculture, manufacturing and services cover broad activities and contain considerable regional variation. A photograph of farmland cannot establish agriculture's current share of national output. Similarly, a technology district illustrates a particular concentration of activity without proving that every city has the same employment structure or digital access.
For a student comparison with Pakistan, choose one indicator and one reporting period. Record the units for both countries, note the source definitions and explain a limitation. A modest comparison that readers can reproduce is stronger than several dramatic rankings assembled from different years, incompatible exchange-rate assumptions and unexplained data revisions.
| Profile question | Suitable evidence | Definition to check |
|---|---|---|
| Where is the country? | Dated atlas or official map | Boundaries and scale |
| What is the terrain? | Relief map | Elevation categories |
| How many people live there? | Census or demographic estimate | Reference year and coverage |
| How urban is the population? | Statistical release | Urban classification |
| How large is the economy? | National accounts | Prices, currency and period |
| Which languages are used? | Legal text and language statistics | Official role versus usage |
How can you judge whether a source supports a claim?
Match the claim to the institution responsible for the information. A national statistical agency is relevant to official population definitions; a weather agency is relevant to climate observations; a constitutional document supports legal terminology. A general portal can help locate those documents, but its homepage does not automatically substantiate every detailed assertion.
Read beyond a search snippet. Check the document title, date, table headings and footnotes. A table labelled provisional may be revised later, while an archived report can remain valuable for a historical comparison. Reliability depends partly on whether the source fits the question, rather than simply whether the page looks official or appears near the top of search results.
Create a source note containing the exact claim, the supporting table or paragraph, the reference period and your interpretation. For example, the claim that one district has a higher measured literacy rate than another needs the same literacy definition and comparable coverage. A broader statement about educational quality would need additional evidence beyond that single statistic.
Keep observation, inference and opinion distinct. A map may show a port near a large city. You may infer that maritime trade contributes to its transport connections, but the map alone does not establish trade volumes or employment shares. Labelling that distinction makes an assignment more credible and reveals which follow-up document would actually answer the remaining question.
What should a strong one-page India assignment include?
A strong assignment combines a labelled map, a short physical-geography explanation, a carefully defined demographic fact, a cultural example and a dated source note. It should answer a clear question rather than attempt to compress every aspect of the country into a page. Select evidence that supports a connected explanation.
Begin with a question such as how physical geography influences settlement and transport. Give the map a readable legend, label only the features needed and write one paragraph linking them. Then add a small comparison of two locations. The comparison should explain a relationship, such as coast versus inland setting, rather than become a disconnected list of attractions.
Choose a cultural or language example that adds detail without claiming universality. Finish the main text with one statistical fact whose definition is clear and one limitation that affects interpretation. This combination demonstrates geographical knowledge, respect for diversity and numerical literacy. It also creates a structure that a teacher can assess for reasoning instead of recall alone.
Before submission, ask another student to identify every sentence containing a number, a superlative or a legal claim. Each should have an appropriate supporting note. Next, ask them to explain what the map contributes to the argument. If the image is decorative and the paragraph works without it, revise the assignment so the geography is doing useful explanatory work.
A reusable study method
After completing the profile, close the sources and explain the country through three connections: landforms and settlement, seasonal rainfall and activity, regional diversity and institutions. Reopen the notes to check the details you remembered. This retrieval exercise helps separate understanding from copied wording and highlights gaps that need another map, a clearer definition or a better source.
A final comparison exercise can strengthen the method. Give two classmates different maps of the same area, one physical and one political, and ask them to describe what each reveals and conceals. Neither map is a complete country profile. Combining their information thoughtfully is the skill: knowing which representation answers a question, which assumptions it contains and when another kind of evidence is required.
Use an evidence ledger when revising. Put the draft sentence in the left column, the source detail in the middle and any qualification in the right. If the source supports only a narrower statement, narrow the sentence. This is especially useful for claims about diversity, where an individual example can easily be stretched into an unsupported national generalisation during editing.
For related terminology, read the country and state explainer. Compare the method with the Qatar geography primer, then use the Pakistan economy guide when defining economic comparisons. These related lessons address different parts of the same source-reading task.
Sources
Source 1 Source 2 Source 3 Source 4
Image credits: Cover: Uwe Dedering, source, CC BY-SA 3.0. Resized and converted to WebP. Article image: Ali Zifan, source, CC BY-SA 4.0. Resized and converted to WebP.
Result dates, fees and eligibility must be checked against the issuing authority's current notice. Report a correction with the article URL and original source.