
Roston Chase: Reading an All-Round Cricket Record
Read Roston Chase’s batting and bowling records with format, role and sample size in mind, using the official West Indies player profile.
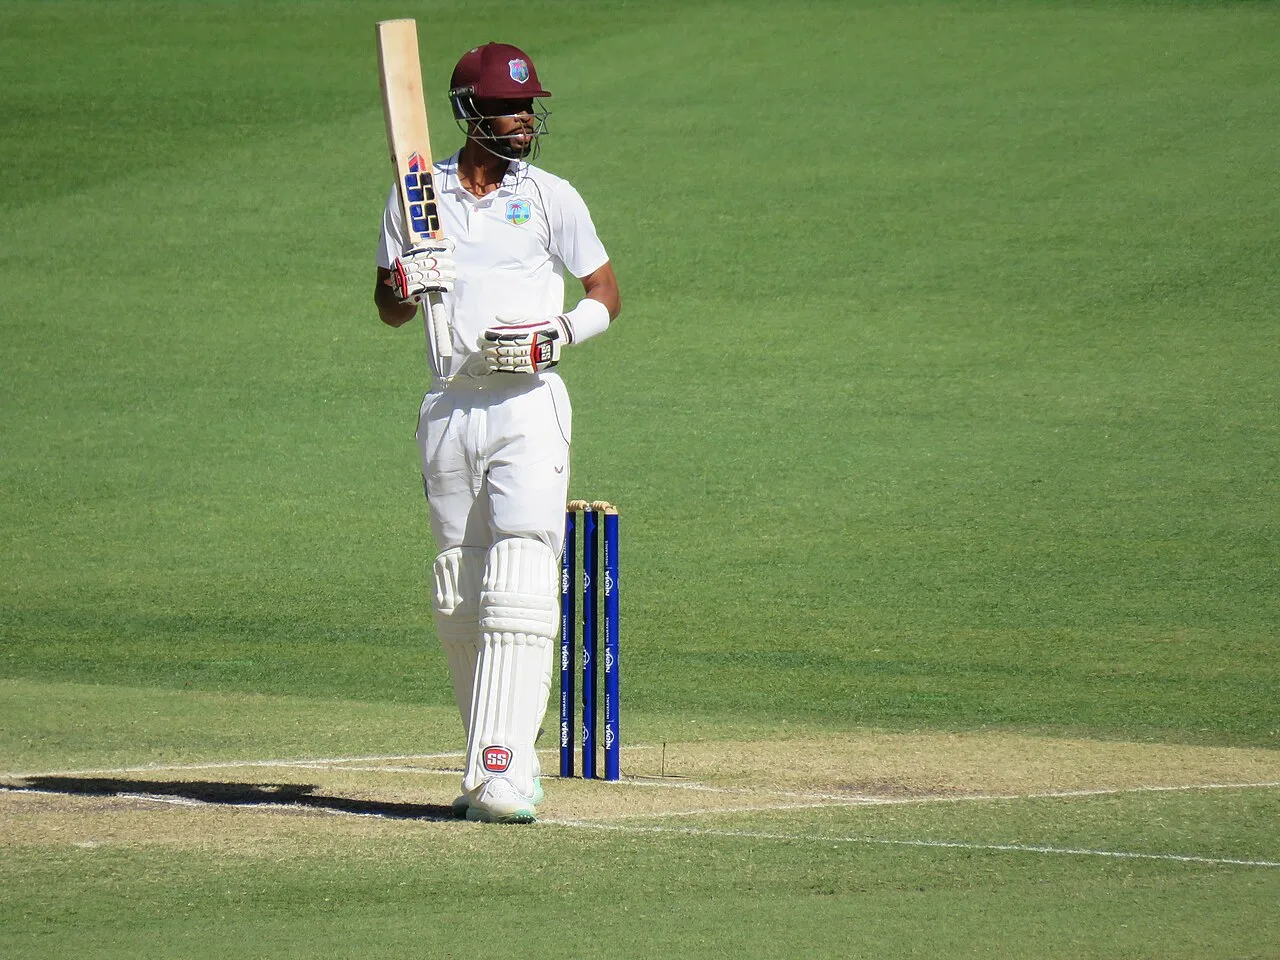
Roston Chase's cricket record should be read as separate batting, bowling and fielding evidence within a stated format and period. A single average cannot capture an all-rounder, and a combined career total can hide important differences between competitions. The useful approach is to understand the calculation before deciding what it says about the player.
Cricket West Indies' official profile provides a starting point for Chase's identity and separate statistical categories, including right-hand batting and off-spin bowling. This guide concentrates on reading those categories accurately. All small numerical datasets below are hypothetical teaching examples, not Chase's actual match or career figures.
Which Roston Chase record should you open first?
Open the record for the question you want to answer: a match record for one appearance, a season record for a defined campaign, or a career record for a broader summary. Select the format before copying figures. The same player profile can contain several tables that should not be merged casually.
Test, ODI and T20I records describe different international formats. First-class, List A and domestic T20 records are broader statistical classifications with their own scope. A recognised international appearance may also sit within a wider classification, so adding overlapping totals can double-count matches.
Write down the table heading and retrieval date. A changing profile can show a different aggregate after another appearance. Without the date, two accurate extracts may look contradictory even though they were captured at different points.
Check whether the table describes batting, bowling or fielding. A column abbreviated average may use a different denominator in each discipline. The label alone is insufficient; read the heading and the surrounding columns.
Start with a simple research question, such as how batting contributions varied in one selected series. That creates a more defensible comparison than copying the largest available career number and treating it as a complete assessment.
How do not outs change batting average?
Batting average divides runs by dismissals, not simply by matches or innings. Not outs therefore affect the denominator. This makes the statistic useful for one purpose, but it also means it should be read alongside batting position, opportunities and the number of completed innings.
Consider a hypothetical sequence of 20, 40 not out and 30. The total is 90 runs across three innings but only two dismissals, producing an average of 45. Dividing by three would give 30, which is runs per innings rather than batting average.
A not out can arise in different situations. A batter may finish a successful chase, remain when the innings closes or run out of partners. The statistical treatment is clear, but the surrounding cricket story differs. Record the situation before using the average to compare roles.
If the sample has no dismissals, the conventional calculation has no finite denominator. A blank field should not be treated as zero performance or silently replaced with an invented average. Explain the sample and the source's display convention.
Keep runs per innings separate
Runs per innings can still be useful when clearly labelled. It answers a different question about typical contribution per appearance at the crease. Reporting both measures with their definitions may be more informative than arguing that only one is the correct description.
What do strike rate and milestone totals add?
Strike rate describes scoring speed, while milestone totals count particular score thresholds. Both add information, but neither explains the full distribution of contributions. Read them with balls faced, entry score and the match's demands before drawing a conclusion about consistency or value.
A hypothetical 45 from 60 balls has a strike rate of 75. A 24 from twelve balls has a strike rate of 200. The second is faster, but the first may involve a longer rebuilding task. The statistic describes speed; the match situation establishes the task.
A century and a fifty are useful milestones, but a score just below a threshold can still be important. A record showing few milestones may include many substantial supporting innings. Conversely, one very large highest score can lift an aggregate while concealing several small contributions.
Use a distribution rather than only a maximum. List the scores in a defined sample and inspect how often meaningful contributions occurred. The median, or middle observation when ordered, can complement an average in a teaching exercise, provided it is clearly labelled and calculated consistently.
Do not describe a player's typical innings from a boundary compilation. The sample has been selected for memorable scoring. A complete match list gives a better basis for asking whether contributions were repeated across different situations.
How do you calculate bowling statistics correctly?
Calculate bowling statistics from total legal balls, runs conceded and credited wickets within the selected category. Bowling average, economy rate and bowling strike rate use different denominators. Partial overs must be converted into balls, and team dismissals must not be confused with wickets credited to the bowler.
A hypothetical spell of 6.2 overs contains 38 legal balls in six-ball overs. If it costs 30 runs and produces two wickets, the bowling average is fifteen runs per wicket. The bowling strike rate is nineteen balls per wicket, and the economy rate is approximately 4.74 runs per over.
A second spell should be added through raw totals. Suppose it contains twelve legal balls, concedes fourteen and produces no wicket. The combined record is fifty balls, 44 runs and two wickets. Recalculate each rate from those totals rather than averaging the two displayed rates.
Wickets-based statistics need careful handling when no wicket is taken. A blank average does not imply that the bowler conceded no runs. The record can still describe workload and containment even when a wicket-based ratio cannot be calculated meaningfully.
A five-wicket innings entry describes a particular threshold in bowling performance. It should not be confused with a five-wicket match total assembled across two innings unless the table explicitly uses that definition. Read the column label before making a record claim.
| Statistic | Calculation basis | Common error |
|---|---|---|
| Batting average | Runs divided by dismissals | Dividing by matches |
| Batting strike rate | Runs per 100 balls faced | Confusing speed with average |
| Bowling average | Conceded runs per wicket | Including run-outs as bowler wickets |
| Economy rate | Conceded runs per over | Treating partial overs as decimals |
| Bowling strike rate | Legal balls per wicket | Using runs as the denominator |
Why can two accurate statistical pages disagree?

Trent Bridge on 25 May 2012, with Marlon Samuels batting; use the scoreboard to discuss innings context, not as a Chase performance.
Two pages can disagree because they use different dates, classifications, filters or display conventions. Before deciding that one is wrong, compare their scope. A profile showing all recognised T20 appearances and another showing only T20Is can both be accurate while presenting very different totals.
Check the date filter and season setting first. One page may include the latest completed match while another has not updated. A statistical provider may also correct a scorecard after initial publication, which can alter an aggregate.
Next, inspect whether matches and innings have been confused. In a Test, a player can have more than one batting innings, while in any format a selected player may not bat. These are different counts of participation and opportunity.
Missing data deserves its own label. A blank balls-faced field is not zero balls, and an unavailable fielding entry is not proof that nothing happened. Converting every blank to zero can distort later calculations while making a spreadsheet look complete.
Keep the source extract with the calculation. Another reader should be able to reproduce the result using the same rows. This makes disagreements easier to resolve because the discussion concerns the dataset rather than the reputation of the website.
Use a reconciliation sheet
Create columns for statistic, source date, format and included period. Most apparent contradictions become clearer once those fields are visible. Only investigate arithmetic errors after establishing that the pages genuinely describe the same record.
How do role and conditions change the meaning of a record?
A record becomes more informative when attached to the player's task, opposition and conditions. Batting position affects opportunity; bowling allocation affects workload and wicket chances. Compare similar responsibilities before using a numerical difference to claim improvement, decline or superiority.
For Chase's batting, record the entry score and partners available in each selected match. A lower-order rescue and an innings beginning on a strong platform can produce similar totals through different demands. The context belongs beside the number.
For off-spin, distinguish long spells from short tactical allocations. A captain may seek control, a particular matchup or support for another bowler. The final figures cannot establish which objective applied without the match sequence.
Venue and surface can affect scoring and bowling opportunities, but avoid treating a venue name as a complete explanation. Two matches at the same ground can present different conditions. Use observed evidence and dated reports where the distinction matters.
A comparison window should be selected before looking for a preferred conclusion. If the question concerns one season, include all eligible appearances in that season. Removing difficult matches after seeing the figures creates selection bias.
The sample size also limits confidence. A small group can illustrate the role in those matches, while a broader claim about long-term performance requires more evidence. State the limitation once, clearly, rather than repeating a vague disclaimer after every number.
How should batting, bowling and fielding be combined?
Combine the findings in a structured explanation, not an invented total that adds unlike measures. Batting runs, bowling wickets and catches are different quantities. The useful question is how each contribution addressed the team's needs and how often the player had an opportunity to contribute.
Begin with separate findings. A batting paragraph can explain scoring and the entry situation. A bowling paragraph can explain allocation and effectiveness. A fielding note can identify recorded catches or visible involvement in run-outs without assigning an unsupported numerical value.
Catches depend partly on opportunities. A quiet fielding record may mean the ball rarely reached that position. A highlight can show an excellent take, but it cannot establish the number of chances a player received across an entire period.
Likewise, not bowling is different from bowling unsuccessfully. A short chase may end before all options are needed. Keep an opportunity column in the dataset so that blanks, non-participation and poor results are not treated as the same event.
If a formal analytical model combines contributions, understand its units, assumptions and reference standard before using it. A homemade formula that adds runs to wickets multiplied by an arbitrary number can produce a ranking without a defensible meaning.
Write a role summary instead
A concise role summary might describe a player as providing middle-order batting and a spin option in the selected matches. Add the actual opportunities and outcomes from the verified sample. That communicates more than a mysterious “overall score” that readers cannot interpret.
How can students create an accurate Chase record worksheet?
Choose a narrow question, define a format and period, and keep the raw observations separate from calculated columns. Add source dates and notes on missing information. A good worksheet is small enough to audit and clear enough that another student can reproduce every total.
For batting, record match identity, runs, balls, dismissal status and entry situation. For bowling, record legal balls, runs conceded and credited wickets. For fielding, keep catches and other verified contributions in separate fields. Avoid duplicating an appearance when it appears under several overlapping classifications.
Calculate totals first, then rates. Check the denominator for each formula before formatting the answer to two decimal places. Extra decimal places do not repair an incorrect definition, and rounding individual entries too early can slightly change a later aggregate.
Test the sheet using a deliberately small hypothetical dataset. Include one not out, one wicketless spell and one appearance in which the player did not bat. These cases reveal formula problems that a table of only ordinary completed innings may conceal.
Ask a partner to check one batting row and one bowling row against the source. If the partner cannot tell which field establishes the denominator, improve the labels. “Average” alone is less helpful than “runs per dismissal” in a teaching worksheet.
Present a conclusion the data can support
Write one finding about batting opportunity and one about bowling use. Then explain how those findings interact. Avoid turning a few selected games into a claim about the best all-rounder across every format.
For a final check, compare the prose with the table. Every number should appear in the dataset or follow from a stated calculation. Every technical conclusion should have evidence beyond the number when necessary. Remove phrases such as “always” or “never” unless the defined record genuinely supports them.
The aim is a transparent explanation of Chase's selected record: what was counted, how it was calculated and why the context matters. That skill transfers to any player profile. It helps readers recognise the difference between a real statistical insight and a dramatic number stripped of its definition.
Keep the worksheet after the assignment. When a new match is added, update the raw record and let the formulas recalculate. Compare the changed aggregate with the unchanged underlying method. This shows how a record can move while a careful interpretation remains anchored in clear categories.
Where possible, preserve one partnership sequence beside the batting table and one complete spell beside the bowling figures. These examples help readers connect an aggregate with the cricket it summarises. Choose them through a stated rule, such as the first eligible match, rather than selecting only the most flattering passage.
The all-rounder role guide explains opportunity and team balance, while the bowling-record guide provides another example of identity and classification checks. For a closer look at batting context, use the middle-order innings analysis. Keep the worksheet calculations separate from these interpretations, then connect them explicitly in the final paragraph.
Sources
Image credits: Cover: Calistemon, source, CC BY-SA 4.0. Resized and converted to WebP. Article image: John Sutton, source, CC BY-SA 2.0. Resized and converted to WebP.
Found an error or an outdated detail? Report a correction with the article URL and original source.