
Air Pollution: PM2.5, AQI and Everyday Decisions
Understand air pollution, PM2.5 and AQI, learn why monitoring readings differ, and use official health guidance when planning outdoor activity.
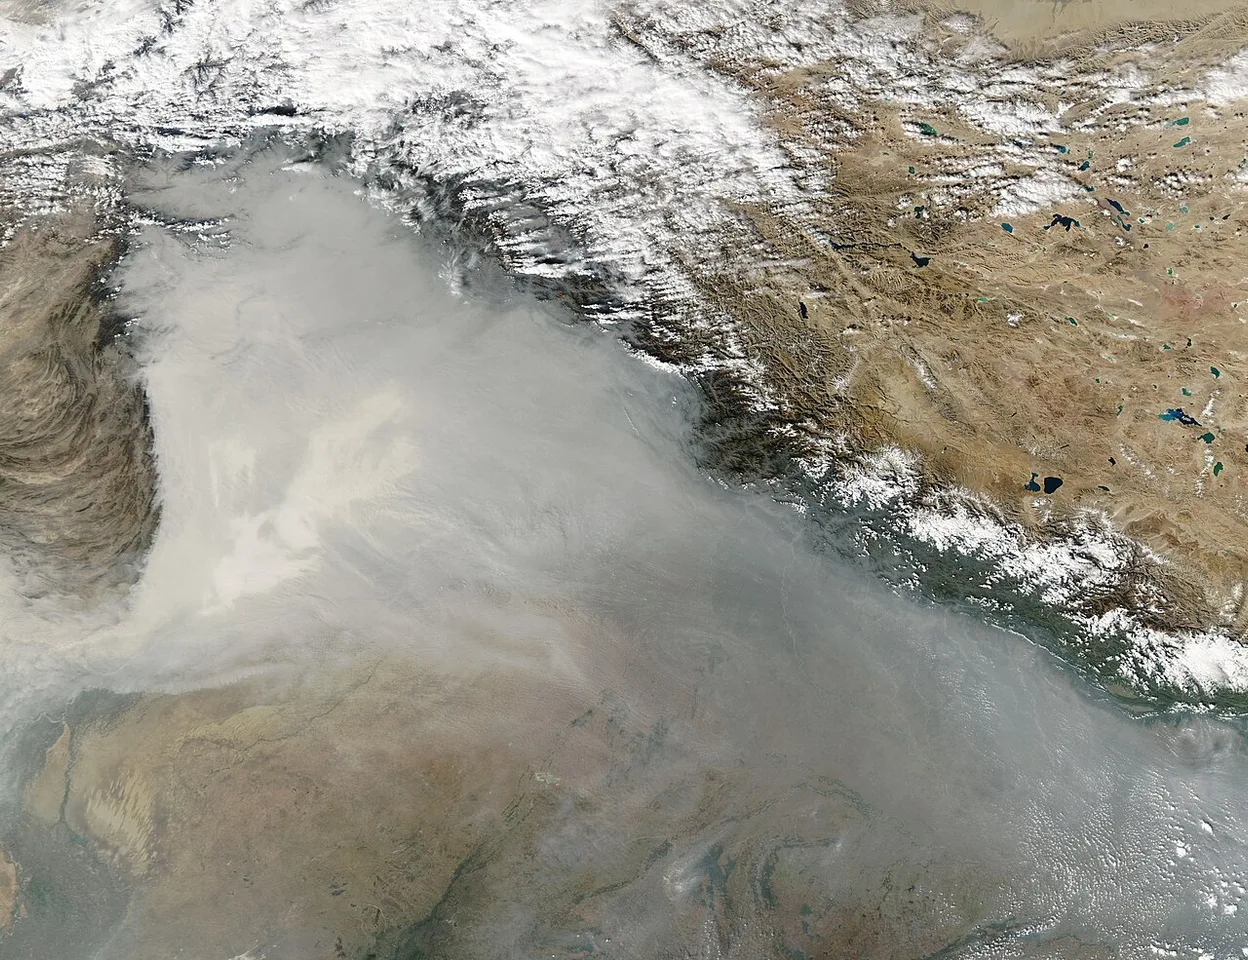
Air pollution includes harmful particles and gases in the air. PM2.5 describes a size category of fine particulate matter, while an air quality index, or AQI, translates monitoring information into a reporting scale. A pollutant concentration, an index value and a weather observation are different kinds of information. Understanding that distinction is the first step toward sensible everyday decisions.
This guide explains how students and families can read an air-quality report, compare observations and plan activities using relevant public-health advice. It does not publish a live reading for Lahore or another city. Practical choices should follow current local guidance and an individual's established care plan, rather than an old screenshot or a single unverified sensor number.
What is PM2.5, and how does it differ from visible dust?
PM2.5 refers to fine inhalable particles generally 2.5 micrometres in diameter or smaller. Particulate matter includes solid particles and liquid droplets, and some particles are too small to see individually. Visible dust and haze can provide clues about conditions, but they are not a precise measurement of PM2.5 concentration or proof of its absence.
The size label is not a list of ingredients. Particles can contain different substances and arise from different processes. EPA material distinguishes particles emitted directly from sources from those formed through atmospheric reactions. That helps explain why a city-wide particle problem cannot be understood simply by looking for one visible pile of dust.
Separate an emission source from an observation point. A roadside monitor records air at its location; it does not automatically identify how much each nearby activity contributed. Establishing source contributions requires appropriate evidence and methods. A photograph of traffic can illustrate a possible source context without proving a complete chemical explanation for the measured air.
For a classroom exercise, ask students to classify statements as definition, observation or explanation. “PM2.5 is a size category” is a definition. “A haze was visible at noon” is an observation. “One factory caused the entire reading” is a causal claim requiring much more evidence. This simple sorting task prevents visual impressions from becoming unsupported scientific conclusions.
Why does exposure matter as well as the reported concentration?
Health risk depends on more than a number displayed on an application. Concentration, duration and the activity being performed all affect exposure, while individual circumstances influence vulnerability. WHO identifies outdoor air pollution as a major health concern, including respiratory and cardiovascular effects. A general reading can guide precautions, but it cannot diagnose an individual's symptoms.
Children, older adults and people with certain heart or lung conditions may need particular care under the relevant guidance. A person with asthma should follow their established action plan and clinician's instructions. Do not change prescribed medicine because a social-media post claims that one pollution reading requires a particular treatment for everyone.
Think about the difference between two activities under the same conditions. A brief necessary journey and prolonged strenuous exercise are not identical exposure situations. AirNow's school guidance explains why reducing exertion or duration can matter when air quality is unhealthy. The appropriate adjustment should still reflect current local advice, the pollutant and the people involved.
Keep symptom decisions separate from a classroom chart. Someone experiencing severe breathing difficulty or another urgent symptom needs prompt medical assessment, not reassurance from a lower number on a phone. Conversely, feeling well does not demonstrate that the air is free of pollution. Measurements and symptoms answer related but different questions.
What does an AQI number mean?
An air quality index converts pollutant information into a scale intended to support communication and action. To interpret the number, identify the index system, pollutant, location and time basis. Different systems can use different breakpoints and averaging methods, so identical-looking numbers from two services are not necessarily comparable without those details.
AirNow's US AQI uses categories such as Good, Moderate and Unhealthy for Sensitive Groups. Those labels belong to that system. Do not attach them automatically to an unexplained number from another scale. A screenshot with a colour and a large numeral may still omit the information needed to understand what is being reported.
Distinguish current reporting from a forecast. A forecast estimates expected conditions, while a current report summarises recent monitoring under its stated method. Neither should be silently relabelled as the other. If a school is deciding about an afternoon activity, both may be useful, but they contribute different kinds of evidence.
Keep concentration and index value separate
A concentration might be reported in micrograms per cubic metre, while AQI is an index value. Do not write the concentration unit after an AQI number or treat the two as interchangeable. If you convert between them, you need the correct pollutant, system and applicable calculation method. A general visual resemblance between charts is insufficient.
Why can two air-quality services show different readings?
Differences can arise from monitor location, measurement method, reporting time, averaging period or index conversion. Before deciding that one service is wrong, compare those details. A roadside observation and a station farther from traffic may describe genuinely different local air, while two displays may also refer to different times or pollutants.
Create a comparison card with six fields: source, station, timestamp, pollutant, unit and averaging period. Add the AQI system if an index is shown. If one service does not disclose a field, mark it unknown. Do not manufacture precision by averaging two numbers that measure different things.
A sensor reading also needs context about quality control and maintenance. A low-cost device can be useful for a learning project, but its output should not automatically be treated as equivalent to a regulatory monitor. For a serious comparison, consult the device and monitoring programme's technical documentation rather than assuming that a familiar display format proves identical accuracy.
Ask whether the disagreement persists after matching place and time. A cached screen may show an older update; a broad city label may conceal different stations. Once you identify the mismatch, describe it specifically. “These reports use different stations” is more useful than declaring that air-quality information is unreliable in general.
The science evidence guide offers a related lesson: a measurement, a classification and a stronger scientific conclusion need different levels of evidence. Apply that distinction when deciding what a monitor can establish about the air around a school.
How should families plan outdoor activity on a polluted day?
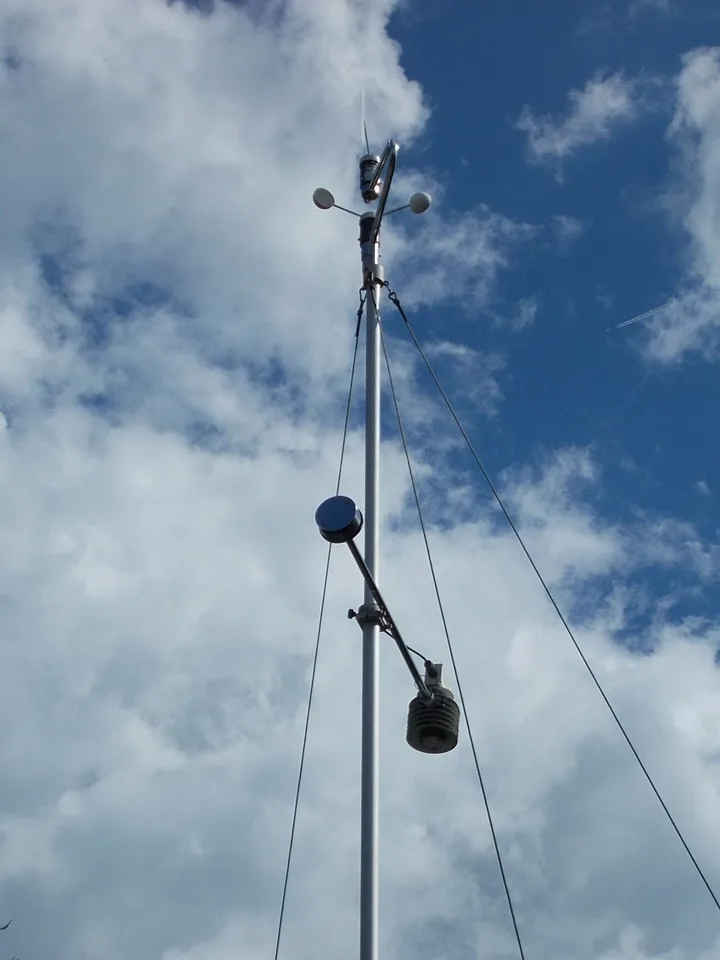
Monitoring equipment in Százhalombatta illustrates station-based measurement. It is not a Pakistani station or a current reading.
Use current local advice and the relevant activity guidance to decide whether to shorten, reduce the intensity of, move or postpone outdoor exertion. Consider the pollutant, conditions and participants. AirNow's school guidance offers a framework for modifying activity, but it should not be presented as a Pakistani legal closure rule or a substitute for local instructions.
Begin with the purpose of the activity. A required journey, a sports session and a short break have different flexibility. Identify which parts can be moved indoors or rescheduled. A useful plan preserves learning and movement where conditions allow while reducing unnecessary exposure, rather than treating every activity as an all-or-nothing choice.
Do not assume that particle pollution is always lowest at one fixed hour. AirNow's school material notes that particle pollution can be high at any time of day. Check the actual report and forecast instead of turning a general seasonal impression into a daily timetable. Weather and local sources can change the pattern.
The student calendar planning guide can help prepare flexible indoor alternatives before a difficult day. The home learning routine guide offers a way to keep a disrupted school day structured. These are organisational tools; health and attendance decisions still follow the applicable advice and individual needs.
Is indoor air automatically cleaner, and what can filtration do?
Indoor conditions depend on outdoor infiltration, ventilation, indoor sources and any effective filtration. Moving inside can reduce some exposures, but the building and its operation matter. EPA guidance explains that suitable portable air cleaners and filters can reduce particles; they do not remove every pollutant or replace control of sources inside the room.
Consider the room as a system. Smoke from cooking, tobacco or other combustion can worsen indoor air, while opening a window can exchange air with outdoors. Whether that exchange helps depends on conditions and sources. A blanket instruction to close every window indefinitely ignores ventilation and other needs, including heat and safe operation of household equipment.
For a particle air cleaner, match the device's capacity to the room and follow its operating and filter-replacement instructions. A high-efficiency filter is useful only when the equipment moves enough air through it and is maintained properly. Noise, placement and power availability can affect whether a household actually uses the device consistently.
Avoid ozone-generating devices marketed as a universal air-cleaning solution. EPA guidance identifies ozone as a concern and warns that some technologies may produce harmful by-products. A pleasant smell or a claim about freshness does not establish particle removal. Evaluate the actual mechanism and specifications rather than a product slogan or an unsupported percentage in an advertisement.
| Report or action | Information needed | Common mistake |
|---|---|---|
| PM2.5 concentration | Unit, station and time basis | Calling it an AQI value |
| AQI report | Index system and pollutant | Comparing incompatible scales |
| Outdoor activity plan | Current advice and participants | Using yesterday's screenshot |
| Indoor alternative | Ventilation, sources and filtration | Assuming every indoor room is cleaner |
| Classroom data project | Consistent method and missing-data notes | Inferring a medical diagnosis |
How can students make a useful air-pollution data project?
Choose one clearly identified monitoring source and record the same variables at a consistent time over a defined period. Keep station, pollutant, unit and reporting method visible. A small consistent dataset can teach comparison and uncertainty; a large collection of incompatible screenshots cannot reliably answer a precise question.
Start with a modest question, such as how the selected source's daily reading varied during one school week. Record missing observations as missing. If the station changes or a service alters its method, mark the change rather than pretending the series is continuous. Keep weather observations in separate columns so their role remains clear.
Plot the values with a labelled vertical axis and an explicit time axis. Do not use an unlabeled colour gradient as a substitute for units. If you display AQI, state the system. If you display concentration, retain the concentration unit. A reader should be able to interpret the chart without guessing from the article's title.
The country-data reading guide provides a useful comparison for handling years, definitions and incompatible measures. Air-quality observations require even closer attention to time because conditions can change within a day. The general lesson is the same: preserve the label that makes a number meaningful.
Distinguish correlation from cause
If a reading rises on a calm day, you have an association in your sample. Explaining the cause requires more evidence about weather, emissions and measurement. Do not label a nearby activity as the cause simply because it happened on the same day. Write a question for further investigation rather than converting a classroom pattern into a definitive attribution.
What should a reliable school air-quality checklist include?
A reliable checklist identifies who checks the information, which source is used, when the decision is made and how activity changes are communicated. It also considers vulnerable students and indoor alternatives. The checklist should implement relevant guidance and established care plans, not invent a universal AQI cutoff or diagnose children from a monitoring display.
Assign responsibility clearly so families receive a consistent message. A teacher may need a current report before a sports lesson, while an administrator may coordinate a broader operational decision. Record the source and time behind the decision. If conditions change, update the plan through the same agreed channel rather than relying on rumours in separate groups.
Prepare alternatives that suit the available space and ventilation. A crowded room with indoor pollution sources is not automatically an adequate substitute for an outdoor session. Review practical constraints before the day becomes difficult. Planning is most useful when the alternative can actually be carried out safely and consistently.
Keep individual health information private. Staff who need an established action plan should have appropriate access, but a class chart does not need students' diagnoses. Teach children how to report feeling unwell without asking them to interpret medical risk from a number. Adults should follow the relevant procedures for symptoms and urgent concerns.
Finish each review by asking what changed: the air report, the activity, the building conditions or the official advice. Update the specific part of the plan affected by that change. This approach makes air-pollution literacy practical: readers learn what PM2.5 and AQI mean, what the evidence can establish and how to make proportionate decisions without treating one screen as a complete health assessment.
Make the chart's limits visible
Add a short note explaining that correlation in the classroom dataset does not establish the source of pollution or a person's health outcome. State the observation period and the missing values beside the chart. If you compare two weeks, use the same source and time basis or explain the difference. This makes the exercise reproducible and prevents a neat visual from suggesting greater certainty than the measurements support.
Ask another student to read the chart without your spoken explanation. If they confuse concentration with AQI, improve the labels before drawing a stronger conclusion.
Sources
Source 1 · Source 2 · Source 3 · Source 4 · Source 5 · Source 6
Image credits: Cover: MODIS Land Rapid Response Team, NASA GSFC, source, Public domain. Resized and converted to WebP. Article image: Globetrotter19, source, CC BY-SA 3.0. Resized and converted to WebP.
Found an error or an outdated detail? Report a correction with the article URL and original source.