
Iran: Geography, Institutions and Reliable Reading
Build a clear Iran country profile and learn to separate geography, official institutions and verified news from undated or misleading claims.
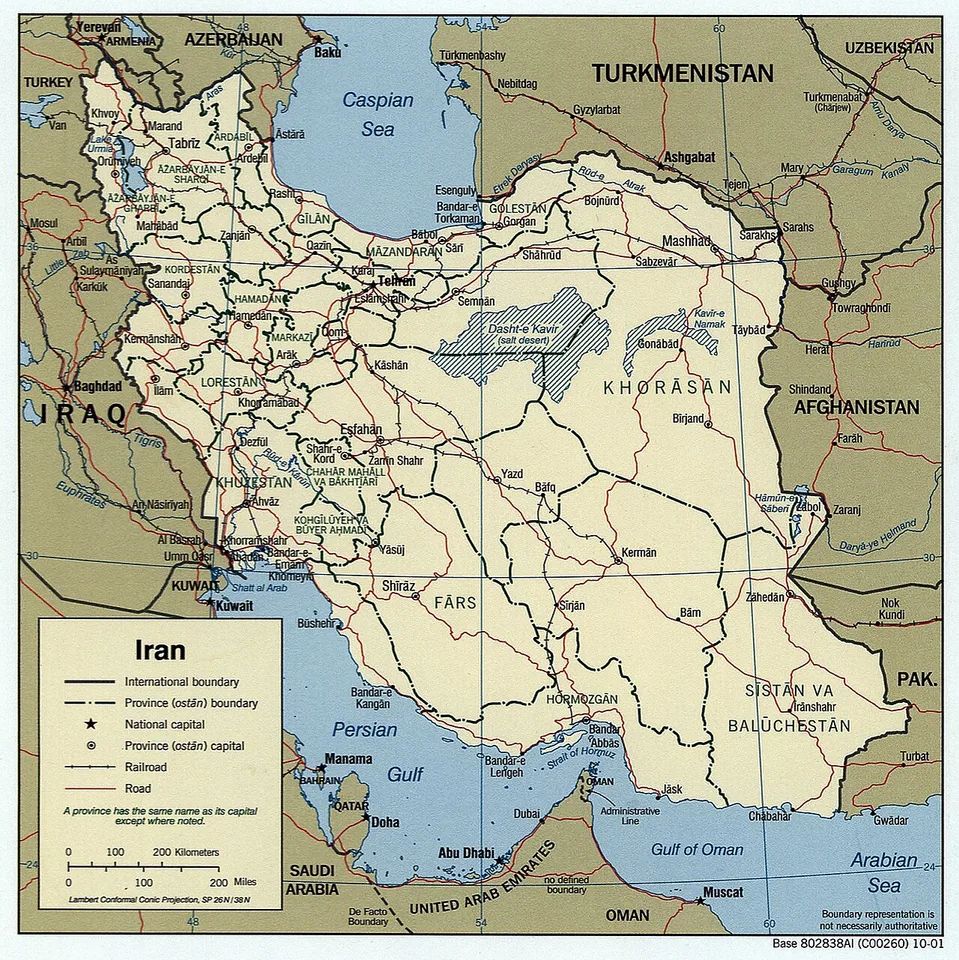
Iran is a country in Western Asia, with Pakistan and Afghanistan to its east, the Caspian Sea to its north and the Persian Gulf and Gulf of Oman to its south. Tehran is its capital. Understanding Iran begins with those geographic relationships, then separates the country's people, institutions and economy from the particular events appearing in today's headlines.
A useful Iran country profile is a research tool rather than a collection of dramatic claims. It explains where a fact comes from, which period it describes and what it cannot establish. This guide uses stable geography and institutional reading methods to help students build that profile. It does not infer a current border condition, officeholder or security development from an old page.
Where is Iran, and what should a regional map show?
Locate Iran between its land neighbours and surrounding seas, then distinguish political borders from coastlines, terrain and transport routes. A regional map should show Pakistan, Afghanistan, Turkey and Iraq alongside the Caspian Sea, Persian Gulf and Gulf of Oman. Use the map legend to understand each symbol before making a geographic argument.
The northern relationship needs particular care. The Caspian Sea is not an open ocean coastline, and a route drawn across water does not automatically represent a land connection. Armenia, Azerbaijan and Turkmenistan also matter to Iran's northern regional setting. A map centred only on the Iran-Pakistan border can hide these wider relationships.
Begin a geography worksheet with three layers. The political map identifies states and boundaries. The physical map shows mountains, plains and water bodies. A thematic map adds a defined subject such as rainfall or population distribution. Keep the layers distinct, because a shaded population area is not a province and an elevation contour is not a disputed boundary.
Scale matters too. A national map can show general location, but it may be unsuitable for estimating a journey between small settlements. A border crossing requires information about actual roads and current procedures. Straight-line distance provides a different measure from travel distance. State which measurement you use instead of turning a classroom sketch into travel advice.
How do physical geography and climate shape a country profile?
Physical geography provides context for settlement, agriculture and movement, but it does not explain every social or political outcome. Examine elevation, water availability and seasonal conditions together. Avoid describing the entire country with a single climate label, because national boundaries contain different landscapes and local environments.
For a school project, compare a coastal location with an inland location using the same kind of climate data. Record the observation period and whether a chart shows a monthly average, an extreme value or one day's weather. A hot afternoon is a weather observation; a long-term pattern requires a longer record. Mixing them produces misleading comparisons.
Water availability is another subject where units change the meaning. Annual rainfall, reservoir storage and river discharge describe different things. A map of dry land cannot establish how much water a city receives through its supply system. Ask which resource is measured, where it is measured and what time interval is covered before explaining a shortage.
Write a geographic explanation carefully
Suppose a map shows a settlement near a mountain range. You can describe the spatial relationship directly. To claim that the mountain caused a particular economic pattern, you would need evidence about transport, water, employment and history. Geography creates opportunities and constraints, but a useful explanation identifies the mechanism rather than treating location as destiny.
Why do Iran population figures sometimes disagree?
Population figures can differ because they describe different years, geographic boundaries or statistical methods. A census count, an official estimate and a modelled projection are not interchangeable. Read the observation year, source note and population definition before deciding that two sources contradict each other or before presenting either as a current count.
The UN country profile collects indicators in one place, but the rows need not share the same reference year. A population estimate may sit beside an education measure from an earlier period. Preserve the year beside each number in your notes. The date a webpage was accessed does not transform every figure on it into a new observation.
Distinguish the population of Tehran city from a metropolitan area or a province. Boundaries change what is being counted. A larger number may reflect a wider geographic definition rather than rapid growth. When comparing cities, use compatible definitions or state the mismatch explicitly. This is particularly important when a search snippet drops the table heading.
National averages also hide variation. Population density divides people by area, but it does not show how evenly people are distributed. An urbanisation percentage describes a classification, not the living conditions of every urban household. A careful paragraph explains the statistic's role and limitation instead of asking one indicator to describe all of society.
How should students describe language, culture and society?
Describe a specific community, practice or source rather than treating one example as a portrait of every Iranian. Language, regional identity, religion and daily life are related but distinct subjects. A national label does not erase internal diversity, and an individual interview does not become a representative survey simply because it is memorable.
Start with the source's own scope. A museum collection may document a particular craft tradition. A language study may focus on a defined group of speakers. A household survey may cover a national sample under stated rules. These sources answer different questions. The best choice depends on whether you are studying cultural expression, language use or measurable social conditions.
Translation deserves a visible place in the research record. Record the original term, the translation used and any uncertainty about meaning. Formal institutional names may differ from familiar English labels. A transliteration is a spelling convention for representing another writing system; variation in spelling does not necessarily identify a different person or place.
For a classroom presentation, choose one documented object, text or practice and explain its context. Say who produced or described it, where it belongs and which interpretation you are offering. Avoid phrases claiming that all people think or behave alike. A specific, supported example is more informative than a broad cultural judgement that cannot be checked.
Which institutions should a reader distinguish in political news?
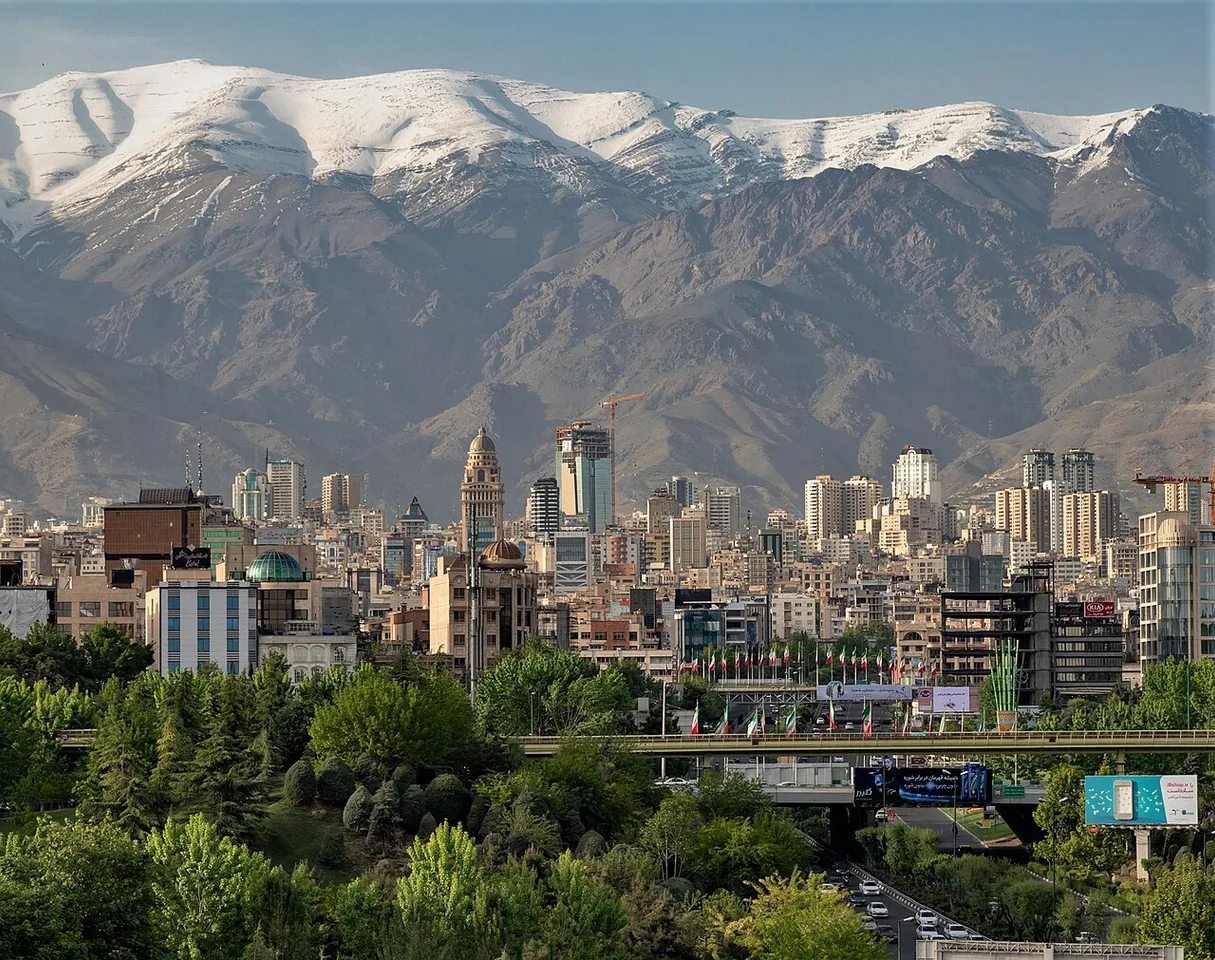
Northern Tehran in 2018 provides a city-scale example for distinguishing a capital from a national country profile.
Distinguish the state, the government of the day, representative institutions, courts and the particular office issuing a statement. Institutional roles come from legal and official documents, while current occupants and decisions require dated verification. A statement from one office should not be attributed to every institution or to the population as a whole.
The formal name Iran (Islamic Republic of) appears in UN records. That label helps identify the state in international data, but it does not explain every domestic institution. For an institutional profile, find the relevant constitutional or official description and record the document date and translation. Treat a summary diagram as an introduction that still needs supporting text.
Follow the verb in a news report. An institution may announce, propose, approve, implement or review a measure. Those verbs identify different stages. If a committee discusses a proposal, the evidence supports that discussion; it does not by itself prove the proposal became law. An official publication or implementation notice is needed for the later claim.
An official source is authoritative about what that body published, but its own claims may require additional evidence. Keep direct statements separate from established outcomes. For example, an announcement of a planned service identifies an intention. Evidence of actual operation would involve a later record showing what began, where it operated and under which conditions.
How can Iran economy data be compared responsibly?
Compare indicators only after checking their definition, unit, year and price basis. GDP, GDP per person, trade values and consumer prices describe different parts of an economy. A rise in one measure does not automatically show that every household became better off, and a currency conversion is not a complete living-standard comparison.
Nominal values use prices associated with their reporting period, while real measures attempt to account for price change under a specified method. Purchasing power comparisons use another framework. Label the measure you actually have. Avoid copying the word “growth” from a headline when the underlying table reports a level rather than a rate of change.
Trade data needs similar discipline. Exports may be reported by value or physical quantity, and goods trade differs from trade including services. A bilateral figure for trade with Pakistan is not the same as total external trade. Check whether a table reports a calendar year or another reporting period before comparing adjacent entries.
For a simple classroom exercise, choose two indicators and write a separate question for each. One could concern national output and the other access to a service. Explain why neither alone proves a complete economic story. If sources use different years, keep the difference visible rather than combining the numbers into an apparently precise current assessment.
| Profile component | Useful evidence | Common reading error |
|---|---|---|
| Location | Labelled regional map | Confusing a coast with a land border |
| Population | Dated count or estimate | Treating a projection as a census |
| Institutions | Official role descriptions | Turning a proposal into enacted policy |
| Economy | Defined statistical series | Comparing incompatible units |
| Current events | Dated original statements and records | Reusing an old event as today's news |
How can a reader check a viral Iran headline or video?
Identify the original claim, then verify its date, location and source independently of the caption. A real video can be attached to the wrong event, and an old official statement can circulate as breaking news. Establish what the material shows before deciding whether it supports the wider explanation attached to it.
Write the claim as a sentence that can be tested. “This clip was recorded at this place on this date” is more useful than “the video proves everything.” Look for the earliest available upload, visible landmarks and the full recording. An upload timestamp establishes when a file appeared on that account, not necessarily when the scene occurred.
Separate an eyewitness account from an institutional statement and from later analysis. They may each add useful information without answering the same question. When accounts conflict, state the disagreement precisely. Repetition across many accounts does not create independent confirmation if all of them copied the same unverified original post.
Avoid guessing missing casualty totals, motives or identities from low-quality footage. A map pin or translated caption can also be wrong. If a key fact remains unresolved, omit the unsupported conclusion and describe the evidence you do have. Accuracy improves when uncertainty is tied to a specific missing fact rather than expressed through vague disclaimers.
What would a strong student country-study project contain?
A strong project combines a labelled map, a small dated data table, an explanation of institutional roles and a clearly sourced case study. Each section should answer a different question. The final argument should connect those parts while preserving the distinction between stable background, measured indicators and changing events.
Begin with a one-paragraph geographic introduction that a classmate can follow without prior knowledge. Add a map legend and scale. In the data table, include columns for indicator, value, year, unit and source. Leave a cell visibly unfilled when evidence is missing instead of substituting a nearby number from another definition.
Turn notes into an explanation
Choose one relationship to investigate, such as the link between settlement and transport. Identify the observation, possible explanation and evidence needed to test it. This makes the project analytical without pretending that a few maps prove a national causal theory. Distinguish your interpretation from the original source's wording throughout the written discussion.
Finish by asking another student to check three items: whether every number has a year, whether every institutional action has an accurate verb and whether every image or map supports the caption. Revise any sentence that exceeds its evidence. The resulting Iran profile will be useful beyond a single news cycle because it teaches readers how to update it responsibly.
Keep an update log for the profile
A country study becomes easier to maintain when changes are recorded rather than silently overwritten. Add a short note whenever you replace a statistic: identify the old reference year, the new reference year and the reason for the update. If the definition also changed, explain that the two entries may not form a continuous series. This prevents a later reader from interpreting a methodological change as a sudden national development.
Keep an access date for online records and a publication date for the underlying material. Save the table title and relevant footnote with your research notes. A link alone may lead to a page that later displays a newer series, leaving a reader unable to reconstruct your original calculation.
When presenting the project aloud, state one conclusion with strong evidence and one question requiring further research. This shows both what you learned and how the investigation could develop. It also encourages classmates to evaluate the method instead of rewarding the longest collection of disconnected facts.
The country and state terminology guide can support the institutional section. Compare the same research method with the India geography guide and the Qatar geography primer, keeping each country's evidence separate rather than copying one regional description across national profiles.
Sources
Source 1 · Source 2 · Source 3
Image credits: Cover: United States Central Intelligence Agency, source, Public domain. Resized and converted to WebP. Article image: Ninara from Helsinki, Finland, source, CC BY-SA 3.0. Resized and converted to WebP.
Found an error or an outdated detail? Report a correction with the article URL and original source.