
Zimbabwe: Country Geography and Cricket Context
Build a Zimbabwe country profile with geography and dated sources, then distinguish national facts from cricket-team fixtures and performance records.
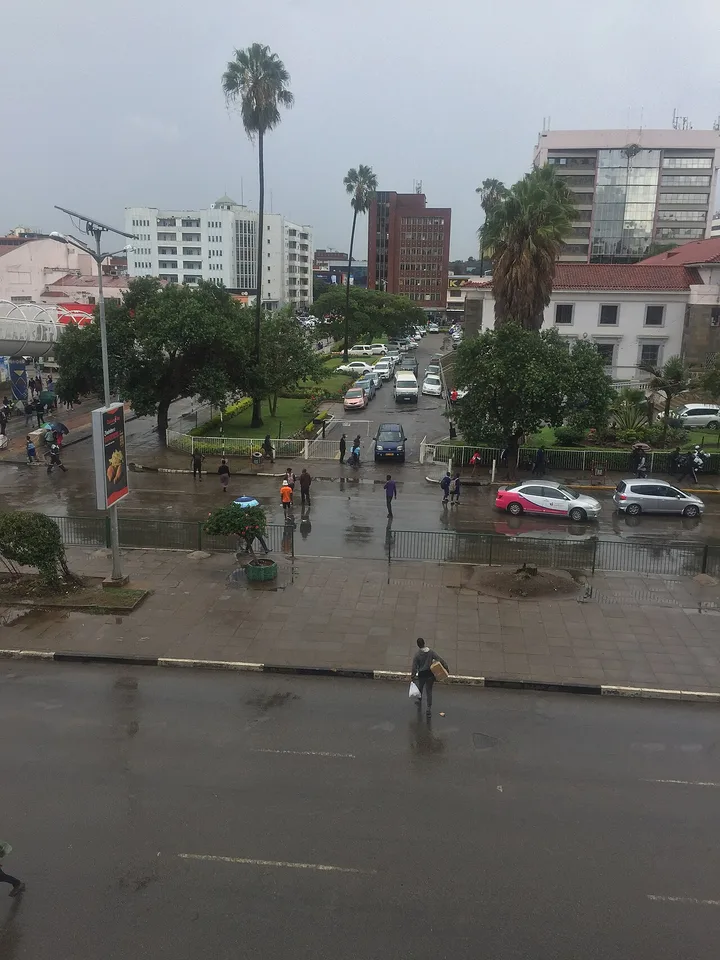
Zimbabwe is a landlocked country in southern Africa, with Harare as its capital. It is also a name frequently encountered in cricket coverage. Understanding the country requires more than following its national team: geography, settlements, heritage and institutions answer different questions and need different evidence.
A useful Zimbabwe country profile starts with the country's position between its neighbours, then connects terrain and rivers with human activity. It should also distinguish the modern state from the archaeological site called Great Zimbabwe. The shared name makes the relationship worth studying, but the site and the country are not the same geographic unit.
For a student in Pakistan, this is an opportunity to practise transferable research skills. Locate a place, label what a number measures and separate a sporting event from a national description. The questions below build a coherent school project without depending on a live result, an undated statistic or a stereotype.
Where is Zimbabwe and what does landlocked mean?
Zimbabwe lies in southern Africa and borders Zambia, Mozambique, South Africa and Botswana. Landlocked means that it has no coastline on an open sea. This affects the geography of international transport, but it does not mean the country has no rivers, lakes or connections with overseas markets.
On a political map, locate Zambia to the north, Mozambique to the east, South Africa to the south and Botswana to the west or southwest. These directions are an orientation aid; the actual boundaries have shapes that a simplified compass description cannot reproduce.
Next draw a regional inset. Include surrounding territory rather than cropping the map tightly at the national border. This helps explain why a route to a seaport crosses another country and why regional cooperation can matter for moving goods.
A transport corridor is a connected route and associated infrastructure, not simply the shortest straight line on a map. Road quality, rail connections, border procedures and the destination affect the practical route. Do not infer an actual freight journey solely from the nearest visible coast.
The term landlocked also differs from isolated. Regional trade, communications and migration connect places across boundaries. To describe a particular connection, identify the route or institution and attach a source rather than turning the general location into a claim about every business or resident.
For a map exercise, ask which neighbouring country a proposed route would cross. Then compare the sketch with an official regional map. This turns memorised neighbour names into an explanation of spatial relationships and introduces the difference between distance, access and administrative boundaries.
How do rivers and high ground organise the physical map?
Study the broad plateau, the Eastern Highlands and the river systems before adding detailed land-use claims. The Zambezi marks much of the northern boundary with Zambia, while the Limpopo is associated with the southern boundary with South Africa. These features provide a useful framework for reading a relief map.
A plateau is an elevated area with substantial relatively level ground; it is not necessarily a perfectly flat surface. Elevation describes height, while relief describes differences in height across a landscape. Keeping those ideas separate makes a physical description more precise.
The Eastern Highlands provide a contrasting area of higher terrain near the eastern side of the country. Locate them before comparing an eastern landscape photograph with one from a lower river valley. Apparent differences in vegetation or visibility need location and season information before they become climate conclusions.
Trace drainage from higher areas into a river basin. A basin includes land contributing water to a river system. Its boundary need not match a province or district, so a catchment map and an administrative map can legitimately divide the same territory differently.
Read the map legend carefully. Brown shading may indicate higher ground on one map but soil type on another. A blue line might indicate a permanent river or a more limited watercourse, depending on the symbol system. Record the map's purpose before interpreting its colours.
A strong comparison uses two layers at a time: elevation and rivers, or rivers and settlements. Adding too many layers can make a small diagram unreadable. Explain one visible relationship, identify what remains uncertain and avoid claiming that a map alone proves why people chose every settlement location.
Why are Harare, Bulawayo and administrative areas different kinds of labels?
Harare is the national capital, while Bulawayo is another major city. A city name, an administrative area and an urban population total can describe different boundaries. State the unit you mean before comparing places, calculating density or transferring a number from a statistical table into an assignment.
A map dot identifies a location but usually does not show the full extent of a city. An urban boundary may include connected settlement beyond a central district. A province or other administrative area can cover a wider territory again. The map scale determines which distinctions are visible.
Suppose an imaginary table counts a municipality and another counts an urban agglomeration. Different totals may arise from coverage rather than disagreement about the people counted. You must inspect definitions before calculating a growth rate or describing one place as larger.
The same caution applies to household information. A household count is not a population count, and household size is a separate measure. Multiplying by an assumed average can create an estimate, but it should not be presented as an official enumeration.
For a settlement comparison, use the same categories for both places: geographic location, administrative role, data boundary and source date. Leave a category unresolved if the source does not define it. A blank marked for further research is more honest and more useful than a guessed label.
This method also improves map captions. Instead of “Zimbabwe city,” write the identified place and what the image actually shows. A street scene can illustrate part of Harare without claiming to represent all urban life in the country.
What can Great Zimbabwe teach about historical evidence?
Great Zimbabwe is an archaeological site whose surviving stone structures offer evidence of an important historical settlement. UNESCO identifies the Hill Ruins, Great Enclosure and Valley Ruins as major groups within the property. Studying these features teaches how material evidence and historical interpretation work together without making them identical.
Dry stone construction uses carefully arranged stone without the conventional mortar seen in many later masonry systems. A photograph can reveal wall form and surviving decoration, but cannot independently tell you every building's original function or the complete appearance of the settlement.
The heritage description associates the site with Shona history and explains its significance within the region. Use that documented interpretation rather than repeating an unsupported story about an unknown outside builder. Archaeology requires evidence about materials, context, dating and relationships between features.
Distinguish the surviving monument from a reconstruction drawing. A reconstruction may combine visible remains with scholarly interpretation. Its caption should explain that status, especially if missing roofs, domestic structures or everyday activity are depicted.
You can practise this distinction with a two-column notebook. Record “visible or documented evidence” on one side and “interpretation or research question” on the other. For example, a wall's curve may be visible, while the reason for a particular design requires additional analysis.
Heritage is also a present responsibility. A site's historical importance does not justify climbing fragile structures or removing objects. In a classroom project, discuss conservation as the work of maintaining evidence for future study. This gives the monument a meaningful place in the country profile beyond a decorative photograph or a tourism slogan.
How should population and economic facts be recorded?
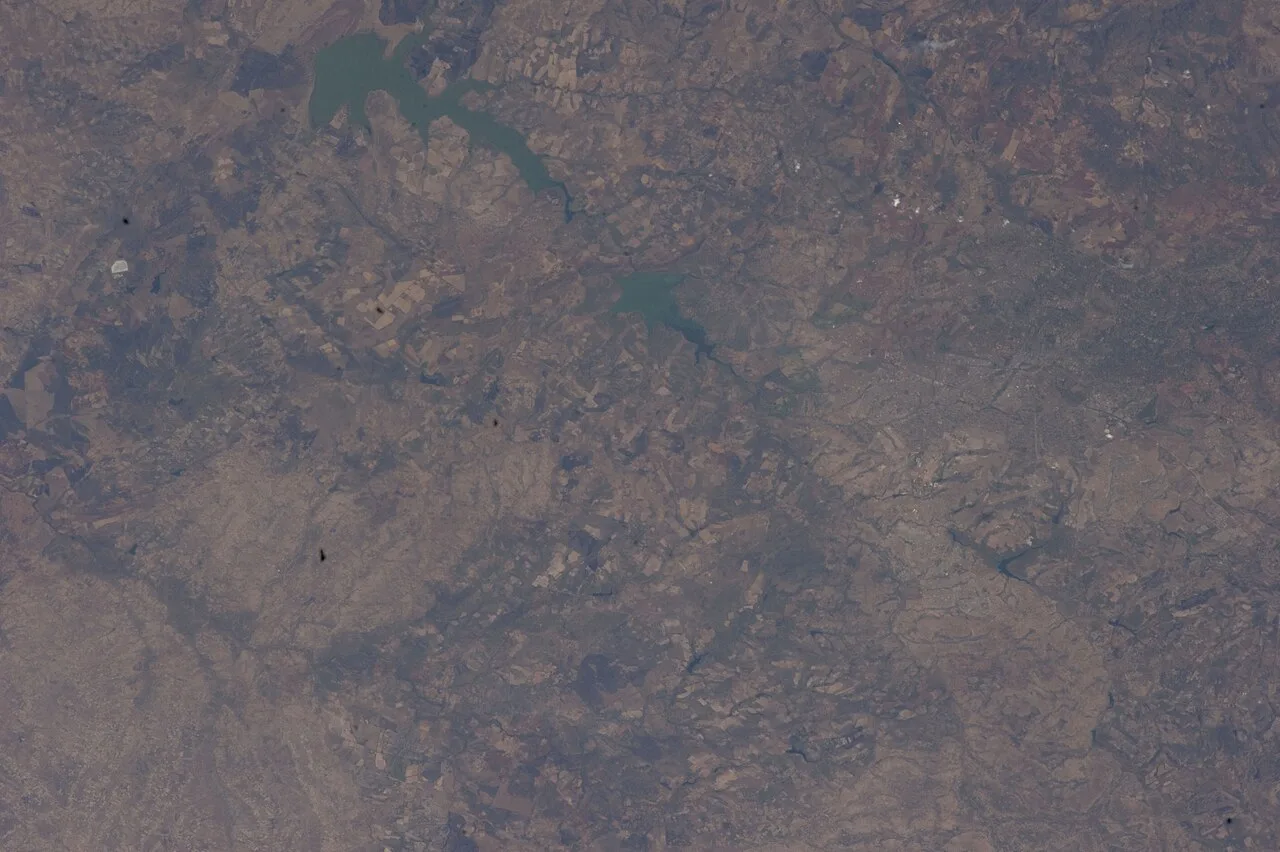
An ISS Expedition 33 photograph offers landscape context for comparing terrain, drainage and settlement.
Record the statistic's year, definition, geographic coverage and publishing institution. ZIMSTAT's census publications provide a primary starting point for population research. A census observation describes a defined counting exercise; an estimate or projection describes a different method. Neither should lose its label when copied into a new table.
For a population chart, check that consecutive observations use compatible boundaries. A change in an urban boundary can alter a total even without an equivalent movement of people. Explain this possibility before interpreting every difference as migration or natural increase.
Urban and rural categories also need the source's definitions. They are statistical classifications, not judgements about a community's importance or quality of life. Avoid turning a percentage into an unsupported description of every household.
Economic indicators present additional choices. National output, household income, inflation and employment each measure something different. A current price measure cannot be compared casually with a constant-price series, and an exchange-rate conversion changes the unit without automatically explaining living standards.
For a short school project, fewer well-labelled facts are preferable to an overcrowded table of mixed years. Choose the facts that answer the project question and explain their relevance. If a recent figure cannot be checked, use a dated historical observation or leave the number out.
A source date is not always the observation date. A report published later may describe an earlier survey period. Keep both in your notes and put the observation period beside the figure in the article. This small habit prevents a current webpage from making old evidence appear newly measured.
How does Zimbabwe Cricket fit into a country profile?
Zimbabwe Cricket concerns sporting administration and competition, while the country profile concerns a much wider range of places and people. Include cricket as a defined activity with its own sources. Identify the national team category, format, opponent and date before discussing selection, performance or a scheduled fixture.
A Test, ODI and T20 are different match formats. Their scoring patterns and time horizons are not interchangeable. A batting total needs its format and situation; a scorecard needs the correct match identity. A tournament table also needs the competition's rules to explain its positions.
Separate a squad announcement from the playing team. Selection for a group does not prove a player took part in a particular match. Likewise, a fixture listing establishes a plan, while a completed scorecard records what was played and the result under that match's conditions.
Venue information can connect sport with geography. Locate the ground and city, compare travel distances and consider how a touring schedule moves through the country. This is a legitimate bridge between subjects without turning sporting performance into a national social indicator.
Avoid describing all residents as cricket followers. A prominent national team represents a sporting institution, not a survey of everyone's interests. A balanced country introduction can acknowledge sport without allowing it to crowd out heritage, settlement and physical geography.
When discussing a player, state the sample behind the claim. One match may illustrate a decision but cannot establish a permanent pattern. That principle mirrors the wider country profile: a well-chosen example teaches something specific, while a sweeping conclusion requires broader evidence.
What comparison makes a research project easier to understand?
Compare sources by the question they can answer rather than ranking them by how official they look. A statistical agency, heritage authority and cricket board have different responsibilities. Matching the institution to the claim makes a project easier to audit and prevents a reliable source being used outside its proper scope.
| Project question | Appropriate evidence | Common mismatch |
|---|---|---|
| Where are the borders? | Government or regional map | Inferring borders from a tourist photograph |
| How was population counted? | Census methodology and tables | Treating an estimate as a headcount |
| Why is a monument significant? | Heritage documentation | Repeating an unattributed legend |
| Who played in a match? | Official scorecard | Treating a squad list as the team |
| What is planned next? | Dated official announcement | Presenting an old schedule as confirmed |
Build the final project around a question such as how geography connects Zimbabwe with its region. The map then supplies location, a transport example demonstrates a connection, and a short heritage section adds historical depth.
Give each section a clear job. If the heritage section starts explaining live exchange rates, the focus has drifted. If the sports section supplies the only account of national identity, the profile needs balance.
Before writing, summarise each source in two sentences: what it establishes and what it does not establish. This is an editing tool, not a paragraph to repeat in the article. It helps you choose the right evidence without burdening readers with repeated disclaimers.
The completed project should make its reasoning visible. A reader ought to understand why a fact was included and how it relates to the question. That is more educational than arranging unrelated facts beneath a flag.
How can you check the finished profile for stereotypes and errors?
Review names, units, boundaries and generalisations separately. Confirm that the modern country, historical site and sporting institution remain distinct. Then ask whether each example is being used at its proper scale. A photograph, match or personal account may illuminate a particular experience without representing the entire country.
Check captions for exact locations and avoid attaching an unverified identity to a person. If an image shows a market, describe the visible activity rather than inventing the income or lifestyle of those pictured. Context improves accuracy without requiring lengthy speculation.
Inspect every comparative adjective. “Larger,” “older” and “more successful” need a defined comparison and evidence. Remove them if they add drama without a measurable meaning. The same applies to claims that a place is typical or universally important to residents.
Read statistics aloud with their units and years. If a sentence sounds incomplete without the label, keep the label in the text. Check that totals, percentages and per-person measures have not changed places during editing.
Finally, explain the profile to someone unfamiliar with the country. They should be able to locate Zimbabwe, distinguish its main research categories and understand why cricket results are only one part of the discussion. If they can also identify where evidence ends and interpretation begins, the project has achieved a valuable research outcome.
Retain a short list of unresolved questions for later study. These might concern a particular river crossing, a city's statistical boundary or the interpretation of a monument feature. Specific unanswered questions create a more productive next lesson than a broad claim that the country has been fully explained.
Sources
Source 1 Source 2 Source 3 Source 4 Source 5
Image credits: Cover: Ryen Gwaze, source, CC BY-SA 4.0. Resized and converted to WebP. Article image: Earth Science and Remote Sensing Unit, Lyndon B. Johnson Space Center, source, Public domain. Resized and converted to WebP.
Result dates, fees and eligibility must be checked against the issuing authority's current notice. Report a correction with the article URL and original source.